Pollution event: what impact on solar energy?

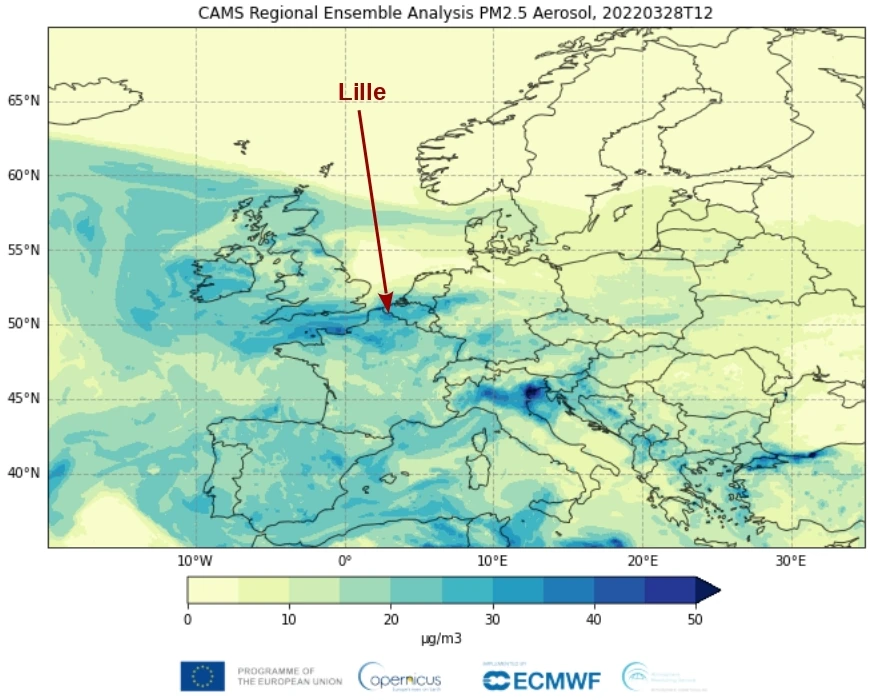
From around 20th March 2022, a pollution event occurred in North of France, and elsewhere in Northern Europe, as showed by the Copernicus Atmospheric Monitoring Service (CAMS). In this analysis, we focus on data acquired at Lille (France), headquarter of HYGEOS, to show the impact of atmospheric pollution on solar energy as can be collected by photovoltaic (PV) panels.

A pollution plume is composed by gases and aerosols. Aerosols are particles in suspension in the atmosphere. The AERosol Robotic NETwork (AERONET) provides measurements indicative of the aerosol load in the atmosphere, called here Aerosol Optical Thickness (AOT). AOT can also be used to estimate the impact of aerosols on solar energy. Such estimates are made with the SolaRes tool developed by HYGEOS.

European map of particulate pollution produced by CAMS on 28th March 2022.

European map, produced by CAMS, of particulate pollution on 28th March 2022

Aerosols are always present in the atmosphere, but in variable loads. On 18th-19th March, background aerosols were responsible for low AOT, and for a loss in solar energy of ~2.3% at Lille. During the pollution event, the AOT increased by a factor of ~6 in one day and, on 20th March afternoon, the aerosols were responsible for a loss in solar energy of 14%, seen in the difference between the blue dashed lines and the red lines in the figure below.
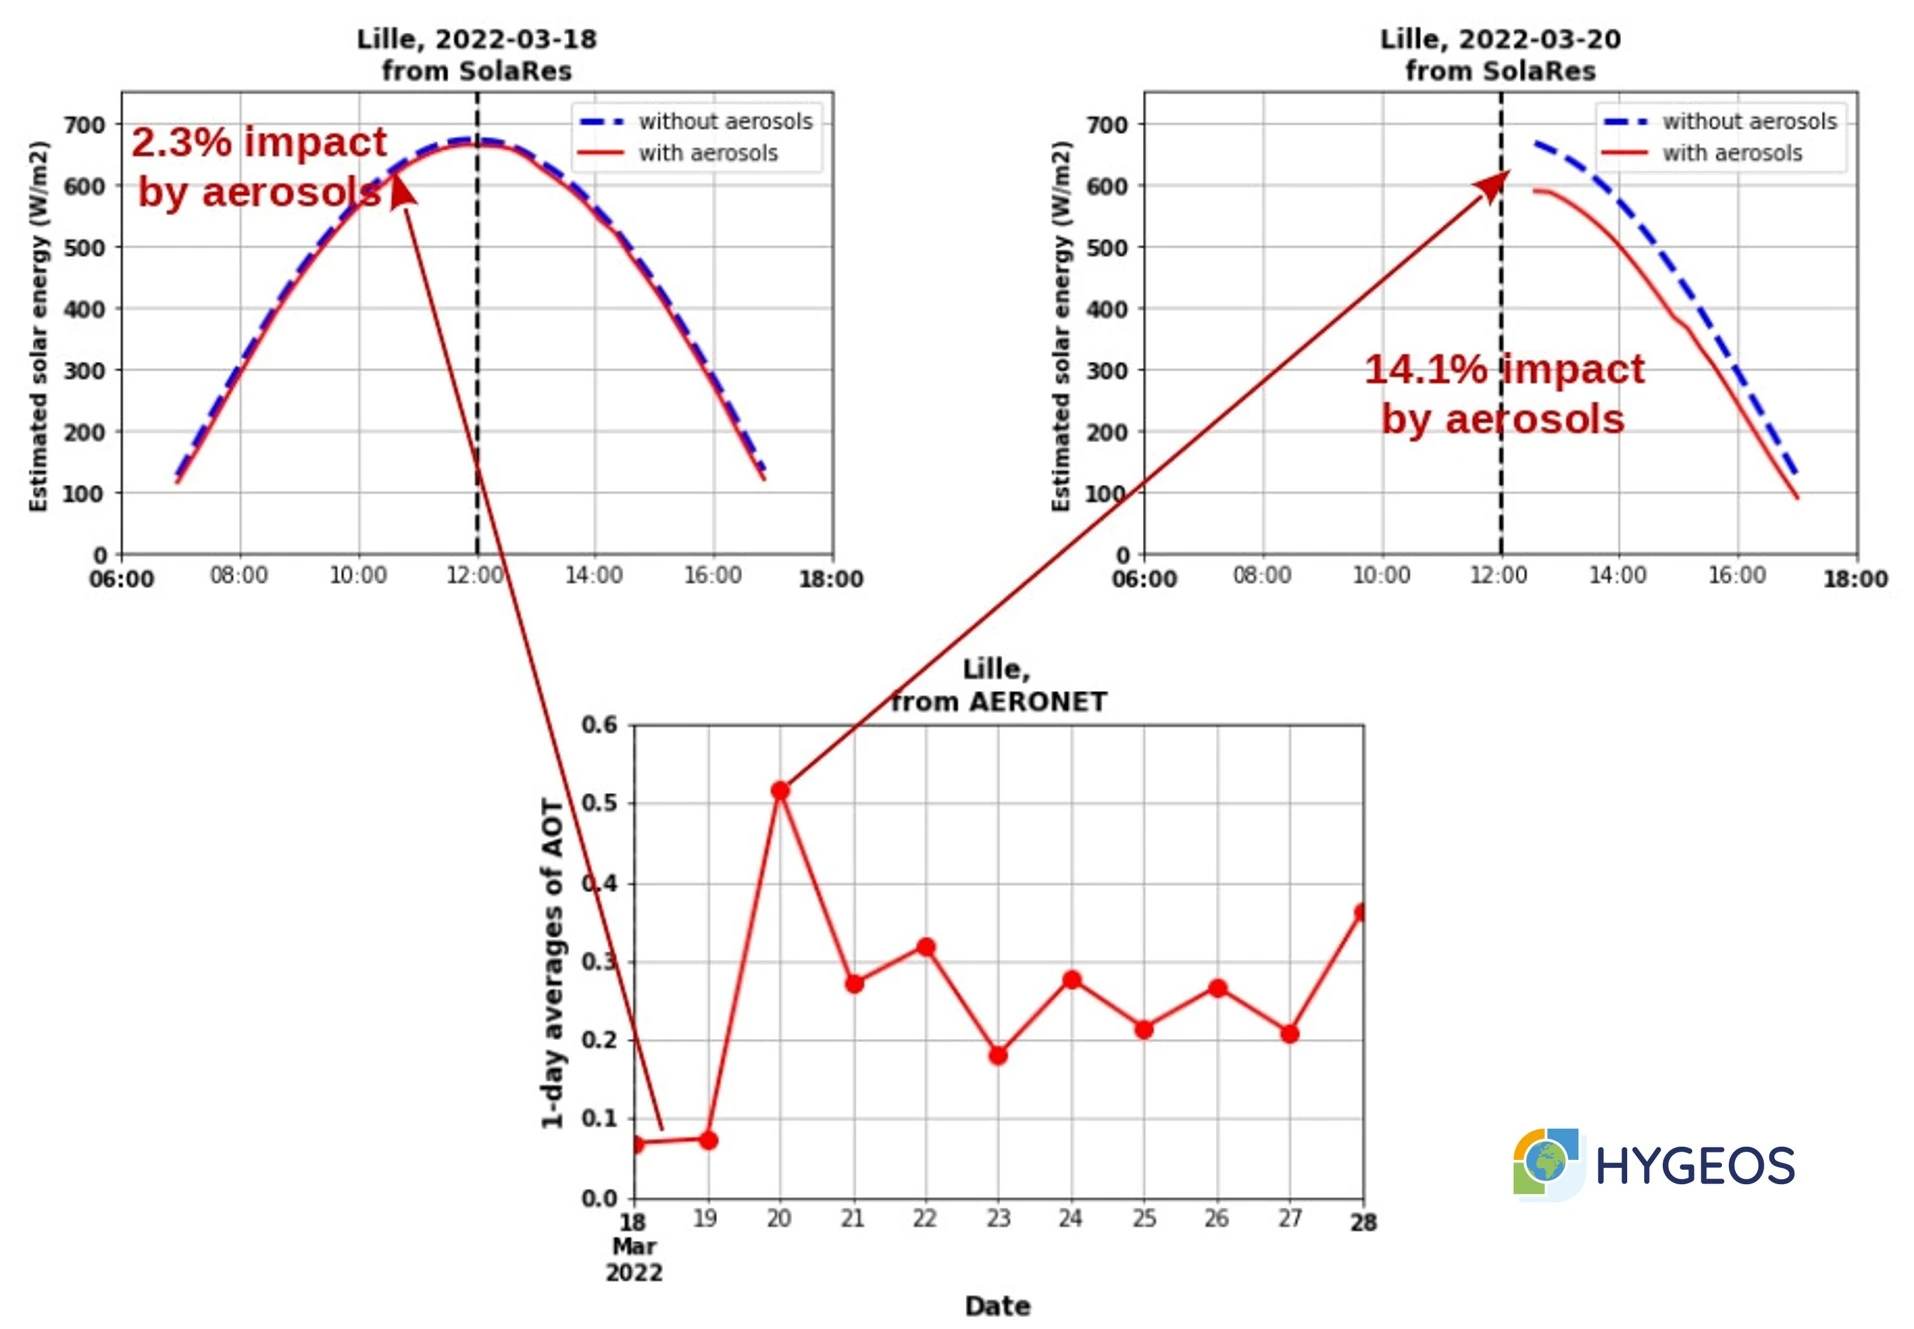
Time evolution of AOT (daily average) during the pollution event (bottom), and impact of aerosols in solar energy (top figures) on 18th March (top left) and 20th March afternoon (top right) at Lille (clouds on 20th March morning prevented AERONET to measure AOT). The blue lines are estimates in case no aerosols are present in the atmosphere, and the red lines are estimates considering the aerosol impact. The difference between blue lines and red lines show the impact of observed aerosols.

Time evolution of AOT (daily average) during the pollution event (bottom), and impact of aerosols in solar energy (top figures) on 18th March (top left) and 20th March afternoon (top right) at Lille (clouds on 20th March morning prevented AERONET to measure AOT). The dashed blue lines are estimates in case no aerosols are present in the atmosphere, and the red lines are estimates considering the aerosol impact.

The pollution event lasted for 9 days, from 20th to 28th March 2022. On 28th March, the pollution aerosol plume gradually converted to a thicker pollution haze probably composed by a mixture of aerosols and liquid water. AOT then increased up to 2.0 around 16:00, with an impact in solar energy stronger than pollution aerosols (more than 27% vs about 15%).
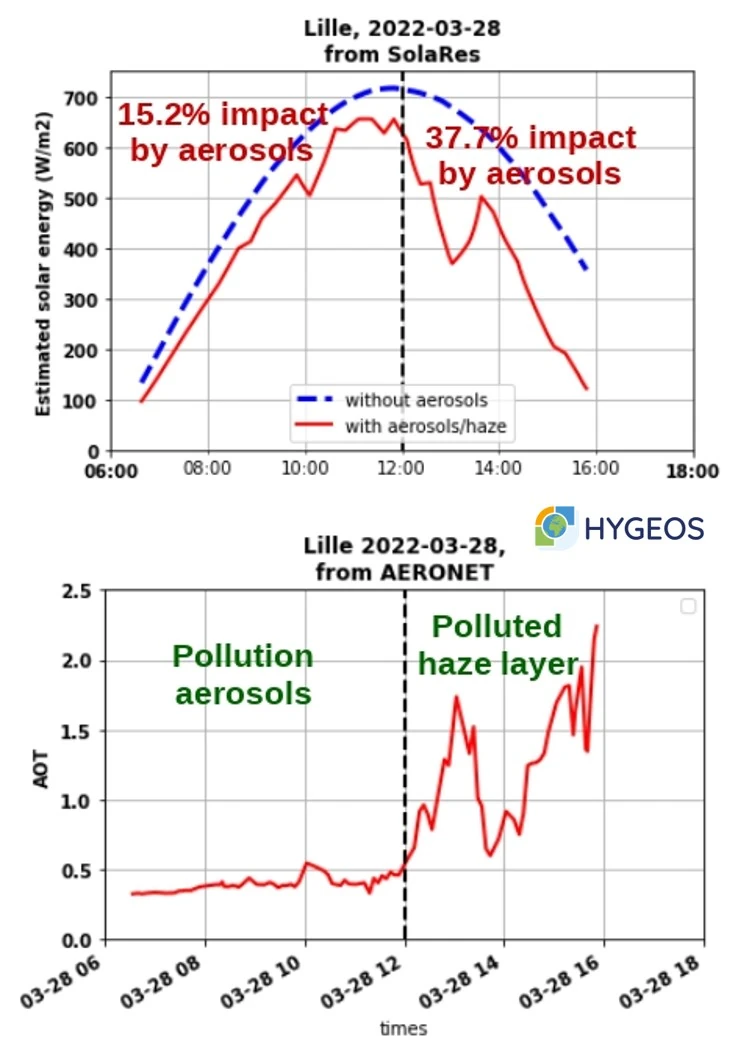
Time evolution of AOT and impact of aerosols in solar energy on 28th March. The blue lines are estimates in case no aerosols are present in the atmosphere, and the red lines are estimates considering the aerosol impact. The difference between blue lines and red lines show the impact of observed aerosols.

Time evolution of AOT (bottom) and impact of aerosols in solar energy (top) at Lille for 28th March 2022.