HYGEOS coordinated an analysis published in the Geoscientific Model Development peer-reviewed journal. It describes and evaluates tropospheric aerosols and chemistry updates proposed for cycle 49R1 of the Integrated Forecast System with atmospheric composition extensions (IFS-COMPO). This latter is used for the operational global Copernicus Atmosphere Monitoring Service (CAMS) forecasts.
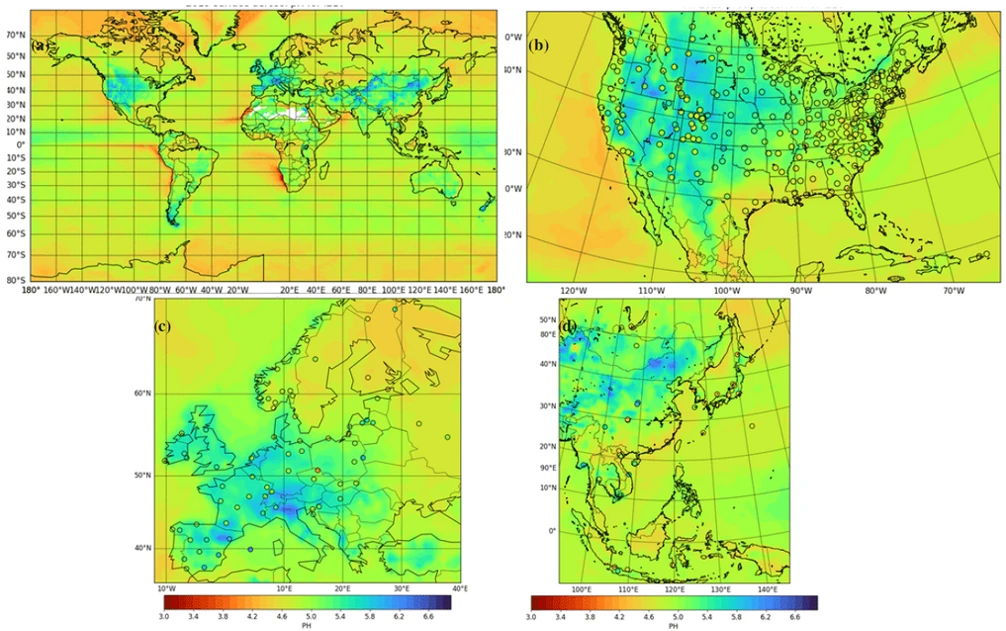
The article Rémy et al., 2024 focuses on one of the main upgrades of cycle 49R1 IFS-COMPO: the use of the EQSAM4Clim thermodynamical module to compute inorganic gas/particle partitioning and the pH of aerosols, clouds and precipitation (figure below). This allows to include experiments pH products to the CAMS product portfolio. The simulated Aerosol Optical Depth (AOD), PM2.5 and PM10 are in general improved by cycle 49R1 as compared to earlier versions. In particular, some significant increase in the skill of the simulated surface concentration of speciated aerosols, such as ammonium and nitrate, is obtained. The simulated precipitation pH compares well against reference simulations as well as ground observations over US, Europe and East Asia. More evaluation is needed to fully assess the new pH diagnostics, especially concerning seasonal variability at specific locations, where this study acts as the groundwork for future datasets that could be provided by CAMS.
Rémy, S., S. Metzger, V. Huijnen, J. E. Williams, and J. Flemming, An improved representation of aerosol in the ECMWF IFS-COMPO 49R1 through the integration of EQSAM4Climv12 – a first attempt at simulating aerosol acidity, Geoscientific Model Development, 17, 7539–7567, 2024. https://doi.org/10.5194/gmd-17-7539-2024


